Room occupancy tracking for university estates teams

Overhead entrance counters send campus counts over Ethernet to dashboards that compare measured use with teaching timetables. Estates staff inspect attendance, busy periods and room capacity when planning teaching spaces.

Room occupancy tracking for university estates teams, image 1 of 2Room occupancy tracking for university estates teams, image 2 of 2
FootfallCam
Headquarters
United Kingdom
Connectivity
Ethernet
Deployment
Public SaaS, Edge/Local
Services
Installation, System Integration, Support & Maintenance

About Room occupancy tracking for university estates teams

Relating actual attendance to the teaching timetable gives estates managers a basis for assessing how university rooms are used. FootfallCam supplies entrance counters, campus dashboards and timetable analytics for lecture rooms, tutorial rooms, libraries and shared facilities. The arrangement can begin at building entrances and extend to the particular rooms or services the university wants to measure.

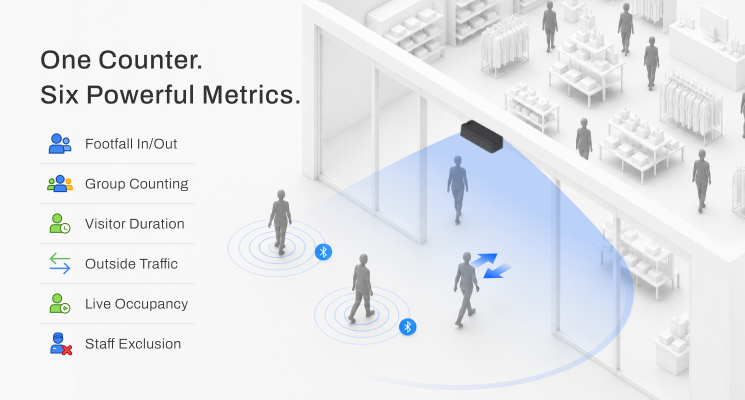
Pro2, the overhead stereo counter, uses PoE and Ethernet to deliver entry and exit measurements to the software. Zone cameras and local processing add the selected area views. Timetable Analytics compares measured attendance with scheduled sessions and room capacity, while building and room dashboards show occupancy, use periods and usage rates. Historical attendance patterns also contribute to forecasts for represented campus facilities.

The estates team reviews lightly used sessions, crowded rooms and repeated peaks before considering a different room allocation. Library and cafeteria patterns help staff plan service coverage, and selected washroom counters support demand-based cleaning. Building summaries let the team compare use across the campus while retaining the detail of individual sessions. These related attendance, schedule and facility records support decisions about room size, resource allocation and the next areas to include in campus monitoring.

How it works

Sense
Count arrivals and departures at selected campus entrances.
Connect
Pass entry and exit metrics over Ethernet to dashboards.
Analyze
Compare measured attendance with timetables and room capacity.
Act
Review room allocations and campus service provision.

Does it fit your project?

Best suited to

  • University estates and campus planning teams
  • Lecture, tutorial and shared teaching rooms
  • Campus library and cafeteria service managers

You need

  • Counters at measured campus entrances
  • PoE for Pro2 entrance counters
  • Ethernet and dashboard network access
  • Timetable and room capacity inputs

Limitations

  • Requires entrance coverage for measured rooms
  • Requires timetables for scheduled-use comparisons
  • Only measured facilities contribute usage records

Cost estimate

1 site, 10 assets, United Kingdom, in USD
$3,300 – $11k
$300 – $1,000
Estimated first year, by component
$1,400 – $4,500$1,600 – $5,100$300 – $1,000
Hardware$1,400 – $4,500

Sensors, gateways and spare units

Installation and setup$1,600 – $5,100

Site survey, mounting, commissioning and configuration

Software and services$300 – $1,000

Platform subscription, connectivity, data and support

This is an estimate by IoT Apps based on comparable deployments, not a quote from FootfallCam.
Get an estimate for your own project and invite FootfallCam to confirm a price and lead time, on this page. Taxes, shipping, civil works and custom integration are not included. How IoT Apps estimates costs

Similar solutions

See all solutions
Thermal Workplace Utilization Analytics
Thermal Workplace Utilization Analyticsby Butlr

Compare workplace occupancy and usage patterns.

More from FootfallCam

Airport Passenger Flow and Queue Operations Monitoring
Airport Passenger Flow and Queue Operations MonitoringMonitor airport queues and passenger throughput.
Library Patron Counting and Facility Usage Analytics
Library Patron Counting and Facility Usage AnalyticsMeasure library footfall and space usage.
Museum Visitor and Exhibit Engagement Analytics
Museum Visitor and Exhibit Engagement AnalyticsCompare museum visits, exhibit occupancy and movement.
Office Occupancy, Booking and Facility Utilization Analytics
Office Occupancy, Booking and Facility Utilization AnalyticsCompare office occupancy with bookings and capacity.
Public Venue Live Occupancy and Crowd Control
Public Venue Live Occupancy and Crowd ControlEstimate venue occupancy and flag crowding limits.
Quick-Service Restaurant Speed and Service Operations Analytics
Quick-Service Restaurant Speed and Service Operations AnalyticsMeasure restaurant waiting times and service flow.

Questions and answers

How is scheduled teaching compared with actual room use?

Timetable Analytics relates measured attendance to scheduled sessions and room capacity. The estates team can inspect peaks, low-use periods and attendance patterns.

Must every campus room be included at the first installation?

No. Monitoring can start at building entrances and extend to lecture rooms, tutorial rooms, libraries, laboratories or other selected facilities.

Which campus views help assess the size of teaching rooms?

Room-usage and session views compare occupancy, attendance and available capacity, helping the team assess whether the allocated room suits the session.

What information supports cafeteria provision planning?

Historical attendance and occupancy patterns contribute to forecasts of demand, allowing cafeteria teams to plan provision for busier periods.

How is this deployment priced?

Every page carries a cost estimate by IoT Apps for your own sites and assets; set your budget and invite FootfallCam to confirm a price and lead time.

What does a deployment cost?

For 1 site with 10 monitored assets in United Kingdom, IoT Apps estimates $3,300 – $11k in the first year and $300 – $1,000 every year after. This is an estimate based on comparable deployments, not a quote from FootfallCam.

VendorFootfallCam, United Kingdom
IndustryOther
ConnectivityEthernet
DeploymentPublic SaaS, Edge/Local
ServicesInstallation, System Integration, Support & Maintenance, Data Analytics, Software Platform
Hardware modelRequired, Mixed Ecosystem, Not Required
Available inUnited Kingdom, Malaysia

Uses this hardware

Recommended
FootfallCam 3D Extend
FootfallCam 3D ExtendFootfallCam · Sensor, Wired
Recommended
FootfallCam 3D MAX
FootfallCam 3D MAXFootfallCam · Sensor, Wired
Recommended
FootfallCam 3D Mini
FootfallCam 3D MiniFootfallCam · Sensor, Short-Range
Recommended
FootfallCam 5D Pro
FootfallCam 5D ProFootfallCam · Sensor, Wired
Recommended
FootfallCam Mesh Hub
FootfallCam Mesh HubFootfallCam · Gateway, Wired
Recommended
FootfallCam Pro2
FootfallCam Pro2FootfallCam · Pro2 · Sensor, Wired
Recommended
FootfallCam Space Sense
FootfallCam Space SenseFootfallCam · Sensor, Short-Range

Have a question for FootfallCam?

IoT Apps Enterprise

Not sure this fits your deployment?

Ask the AI Solution Architect: compare this solution against alternatives, check connectivity for your region and get integration guidance. Included with IoT Apps Enterprise.

Ask the Architect
IoT Apps is an independent platform. Listings do not imply endorsement by or partnership with the vendor. Estimates are indicative and based on comparable deployments, not on vendor quotes.