Ceiling counters supply patron metrics over Ethernet to central dashboards for attendance, group visits and facility use. Library managers compare programme turnout and branch trends when planning services and reporting demand.


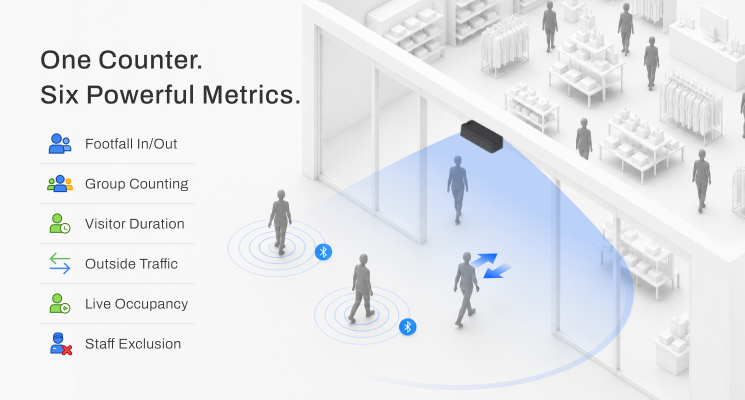
Relating library attendance to programmes and available facilities helps service managers assess how the community uses each branch. FootfallCam combines overhead counters with patron dashboards, regional comparisons and reporting tools. Entry totals, child counts, group visits, visit duration and occupancy provide several views of demand across a library network.
Pro2, the stereo entrance counter, uses one PoE Ethernet connection for power and network communication. Measurements reach the central software, where branch and regional views combine the records. Additional Pro1 or Mini sensors extend coverage to function rooms, archives or children's areas. The selected room sensors give facility-use detail alongside the branch entrance totals, while system-health tools show device and data conditions.
Managers compare programme turnout, peak periods and branch patterns before planning service provision. Scheduled reports can be exported as Excel or PDF files, and API or Power BI links provide additional reporting routes. A library website can display current occupancy and a forecast of busier periods to help patrons plan a visit. The retained attendance and use records also give the management team figures to include when explaining service demand and preparing funding requests.

Set your scope, see what a Visitor counting for library service planning teams deployment costs, then ask FootfallCam to confirm a price and lead time. The estimate is free and needs no contact details.
Sensors, gateways and spare units
Site survey, mounting, commissioning and configuration
Platform subscription, connectivity, data and support
IoT Apps estimate in USD for 1 site and 10 assets in the United Kingdom, from comparable deployments, reviewed September 2026. Not a quote from FootfallCam. Excludes taxes, shipping, civil works and custom integration. How IoT Apps estimates costs
The band starts on the medium range of the estimate. Pick the one that matches your plans, or Not sure; FootfallCam sees your budget as indicative unless you mark it approved.
Name, company and work email are required. Phone is optional.
Hide project detailsCompany size, project stage and decision timing tell FootfallCam how firm the project is and which offer fits: a budgeted project with a decision this quarter gets a firm price and lead time, an early enquiry gets guidance first.
IoT Apps sends the request to FootfallCam and keeps a copy. Vendors usually answer within two working days; IoT Apps follows up if you have no reply after three.

Entrance sensors send directional and regional counts to traffic trends and staffing reports.

Entrance sensors use LoRaWAN to show visitor volumes, flag busy periods and support staffing plans.

Infrared devices send wireless entry and exit totals to dashboards for space-use decisions.

Entrance counters supply live in-out totals, occupancy views and scheduled location comparisons.


Connected counters feed hosted dashboards so stores can compare footfall and adjust staffing.


Yes. The entrance analytics include group and child counts alongside footfall, occupancy and visit-duration measures.
Additional Pro1 or Mini sensors extend the entrance arrangement to function rooms, archives or children's areas, providing zone-level usage records.
The software supports regional and branch dashboards, scheduled Excel or PDF reports, exports and integration through API or Power BI.
A website widget displays current occupancy and forecasts for coming periods, allowing visitors to plan their visit around the represented demand.
Every page carries a cost estimate by IoT Apps for your own sites and assets; set your budget and invite FootfallCam to confirm a price and lead time.
For 1 site with 10 monitored assets in United Kingdom, IoT Apps estimates $3,300 – $11k in the first year and $300 – $1,000 every year after. This is an estimate based on comparable deployments, not a quote from FootfallCam.



Ask the AI Solution Architect: compare this solution against alternatives, check connectivity for your region and get integration guidance. Included with IoT Apps Enterprise.
Ask the Architect